Demo example: Applying Quality Control.#
In this example, we apply Quality Control (QC) on the demo data.
Create your dataset#
We start by creating a dataset.
[1]:
import metobs_toolkit
your_dataset = metobs_toolkit.Dataset()
your_dataset.update_settings(
    input_data_file=metobs_toolkit.demo_datafile, # path to the data file
    input_metadata_file=metobs_toolkit.demo_metadatafile,
    template_file=metobs_toolkit.demo_template,
)

your_dataset.import_data_from_file()
A number of quality control methods are available in the toolkit. We can classify them into two groups:
Quality control for missing/duplicated or invalid timestamps. This is applied to the raw data and is not based on the observational value but merely on the presence of a record.
Quality control for bad observations. These are not automatically executed. These checks are performed in a sequence of specific checks, that are looking for signatures of typically bad observations.
Quality control for missing/duplicated and invalid timestamps#
Since this is applied to the raw data, the following quality control checks are automatically performed when reading the data:
Nan check: Test if the value of an observation can be converted to a numeric value.
Missing check: Test if there are missing records. These missing records are labeled as missing observation or as gap (if there are consecutive missing records).
Duplicate check: Test if each observation (station name, timestamp, observation type) is unique.
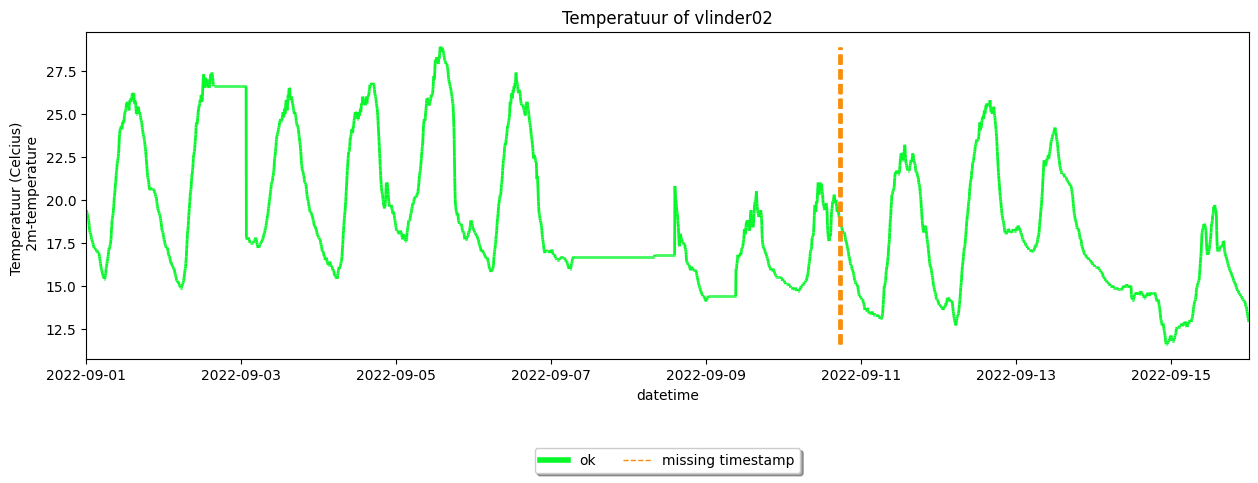
As an example you can see that there is a missing timestamp in the time series of some stations:
[2]:
your_dataset.get_station('vlinder02').make_plot(colorby='label')
[2]:
<Axes: title={'center': 'Temperatuur of vlinder02'}, xlabel='datetime', ylabel='Temperatuur (Celcius) \n 2m-temperature'>
Quality control for bad observations#
The following checks are available:
Gross value check: A threshold check that observations should be between the thresholds
Persistence check: Test observations to change over a specific period.
Repetitions check: Test if an observation changes after several records.
Spike check: Test if observations do not produce spikes in time series.
Window variation check: Test if the variation exceeds the threshold in moving time windows.
Toolkit Buddy check: Spatial buddy check.
TITAN Buddy check: The Titanlib version of the buddy check.
TITAN Spatial consistency test: Apply the Titanlib (robust) Spatial-Consistency-Test (SCT).
Each check requires a set of specific settings, often stored per specific observation type. A set of default settings, for temperature observations, are stored in the settings of each dataset. Use the show() method, and scroll to the QC section to see all QC settings.
[3]:
your_dataset.settings.show()
All settings:

 ---------------------------------------

 ---------------- IO (settings) ----------------------

* output_folder:

  -None

* input_data_file:

  -/home/thoverga/Documents/VLINDER_github/MetObs_toolkit/metobs_toolkit/datafiles/demo_datafile.csv

* input_metadata_file:

  -/home/thoverga/Documents/VLINDER_github/MetObs_toolkit/metobs_toolkit/datafiles/demo_metadatafile.csv

 ---------------- db (settings) ----------------------

 ---------------- time_settings (settings) ----------------------

* target_time_res:

  -60T

* resample_method:

  -nearest

* resample_limit:

  -1

* timezone:

  -UTC

* freq_estimation_method:

  -highest

* freq_estimation_simplify:

  -True

* freq_estimation_simplify_error:

  -2T

 ---------------- app (settings) ----------------------

* print_fmt_datetime:

  -%d/%m/%Y %H:%M:%S

* print_max_n:

  -40

* plot_settings:

  - time_series:

    -{'figsize': (15, 5), 'colormap': 'tab20', 'linewidth': 2, 'linestyle_ok': '-', 'linestyle_fill': '--', 'linezorder': 1, 'scattersize': 4, 'scatterzorder': 3, 'dashedzorder': 2, 'legend_n_columns': 5}

  - spatial_geo:

    -{'extent': [2.260609, 49.25, 6.118359, 52.350618], 'cmap': 'inferno_r', 'n_for_categorical': 5, 'figsize': (10, 15), 'fmt': '%d/%m/%Y %H:%M:%S UTC'}

  - pie_charts:

    -{'figsize': (10, 10), 'anchor_legend_big': (-0.25, 0.75), 'anchor_legend_small': (-3.5, 2.2), 'radius_big': 2.0, 'radius_small': 5.0}

  - color_mapper:

    -{'duplicated_timestamp': '#a32a1f', 'invalid_input': '#900357', 'gross_value': '#f1ff2b', 'persistance': '#f0051c', 'repetitions': '#056ff0', 'step': '#05d4f0', 'window_variation': '#05f0c9', 'buddy_check': '#8300c4', 'titan_buddy_check': '#8300c4', 'titan_sct_resistant_check': '#c17fe1', 'gap': '#f00592', 'missing_timestamp': '#f78e0c', 'linear': '#d406c6', 'model_debias': '#6e1868', 'ok': '#07f72b', 'not checked': '#f7cf07', 'outlier': '#f20000'}

  - diurnal:

    -{'figsize': (10, 10), 'alpha_error_bands': 0.3, 'cmap_continious': 'viridis', 'n_cat_max': 20, 'cmap_categorical': 'tab20', 'legend_n_columns': 5}

  - anual:

    -{'figsize': (10, 10), 'alpha_error_bands': 0.3, 'cmap_continious': 'viridis', 'n_cat_max': 20, 'cmap_categorical': 'tab20', 'legend_n_columns': 5}

  - correlation_heatmap:

    -{'figsize': (10, 10), 'vmin': -1, 'vmax': 1, 'cmap': 'cool', 'x_tick_rot': 65, 'y_tick_rot': 0}

  - correlation_scatter:

    -{'figsize': (10, 10), 'p_bins': [0, 0.001, 0.01, 0.05, 999], 'bins_markers': ['*', 's', '^', 'X'], 'scatter_size': 40, 'scatter_edge_col': 'black', 'scatter_edge_line_width': 0.1, 'ymin': -1.1, 'ymax': 1.1, 'cmap': 'tab20', 'legend_ncols': 3, 'legend_text_size': 7}

* world_boundary_map:

  -/home/thoverga/Documents/VLINDER_github/MetObs_toolkit/metobs_toolkit/settings_files/world_boundaries/WB_countries_Admin0_10m.shp

* display_name_mapper:

  - network:

    -network

  - name:

    -station name

  - call_name:

    -pseudo name

  - location:

    -region

  - lat:

    -latitude

  - lon:

    -longtitude

  - temp:

    -temperature

  - radiation_temp:

    -radiation temperature

  - humidity:

    -humidity

  - precip:

    -precipitation intensity

  - precip_sum:

    -cummulated precipitation

  - wind_speed:

    -wind speed

  - wind_gust:

    -wind gust speed

  - wind_direction:

    -wind direction

  - pressure:

    -air pressure

  - pressure_at_sea_level:

    -corrected pressure at sea level

  - lcz:

    -LCZ

* static_fields:

  -['network', 'name', 'lat', 'lon', 'call_name', 'location', 'lcz']

* categorical_fields:

  -['wind_direction', 'lcz']

* location_info:

  -['network', 'lat', 'lon', 'lcz', 'call_name', 'location']

* default_name:

  -unknown_name

 ---------------- qc (settings) ----------------------

* qc_check_settings:

  - duplicated_timestamp:

    -{'keep': False}

  - persistance:

    -{'temp': {'time_window_to_check': '1h', 'min_num_obs': 5}}

  - repetitions:

    -{'temp': {'max_valid_repetitions': 5}}

  - gross_value:

    -{'temp': {'min_value': -15.0, 'max_value': 39.0}}

  - window_variation:

    -{'temp': {'max_increase_per_second': 0.0022222222222222222, 'max_decrease_per_second': 0.002777777777777778, 'time_window_to_check': '1h', 'min_window_members': 3}}

  - step:

    -{'temp': {'max_increase_per_second': 0.0022222222222222222, 'max_decrease_per_second': -0.002777777777777778}}

  - buddy_check:

    -{'temp': {'radius': 15000, 'num_min': 2, 'threshold': 1.5, 'max_elev_diff': 200, 'elev_gradient': -0.0065, 'min_std': 1.0}}

* qc_checks_info:

  - duplicated_timestamp:

    -{'outlier_flag': 'duplicated timestamp outlier', 'numeric_flag': 1, 'apply_on': 'record'}

  - invalid_input:

    -{'outlier_flag': 'invalid input', 'numeric_flag': 2, 'apply_on': 'obstype'}

  - gross_value:

    -{'outlier_flag': 'gross value outlier', 'numeric_flag': 4, 'apply_on': 'obstype'}

  - persistance:

    -{'outlier_flag': 'persistance outlier', 'numeric_flag': 5, 'apply_on': 'obstype'}

  - repetitions:

    -{'outlier_flag': 'repetitions outlier', 'numeric_flag': 6, 'apply_on': 'obstype'}

  - step:

    -{'outlier_flag': 'in step outlier group', 'numeric_flag': 7, 'apply_on': 'obstype'}

  - window_variation:

    -{'outlier_flag': 'in window variation outlier group', 'numeric_flag': 8, 'apply_on': 'obstype'}

  - buddy_check:

    -{'outlier_flag': 'buddy check outlier', 'numeric_flag': 11, 'apply_on': 'obstype'}

  - titan_buddy_check:

    -{'outlier_flag': 'titan buddy check outlier', 'numeric_flag': 9, 'apply_on': 'obstype'}

  - titan_sct_resistant_check:

    -{'outlier_flag': 'sct resistant check outlier', 'numeric_flag': 10, 'apply_on': 'obstype'}

* titan_check_settings:

  - titan_buddy_check:

    -{'temp': {'radius': 50000, 'num_min': 2, 'threshold': 1.5, 'max_elev_diff': 200, 'elev_gradient': -0.0065, 'min_std': 1.0, 'num_iterations': 1}}

  - titan_sct_resistant_check:

    -{'temp': {'num_min_outer': 3, 'num_max_outer': 10, 'inner_radius': 20000, 'outer_radius': 50000, 'num_iterations': 10, 'num_min_prof': 5, 'min_elev_diff': 100, 'min_horizontal_scale': 250, 'max_horizontal_scale': 100000, 'kth_closest_obs_horizontal_scale': 2, 'vertical_scale': 200, 'mina_deviation': 10, 'maxa_deviation': 10, 'minv_deviation': 1, 'maxv_deviation': 1, 'eps2': 0.5, 'tpos': 5, 'tneg': 8, 'basic': True, 'debug': False}}

* titan_specific_labeler:

  - titan_buddy_check:

    -{'ok': [0], 'outl': [1]}

  - titan_sct_resistant_check:

    -{'ok': [0, -999, 11, 12], 'outl': [1]}

 ---------------- gap (settings) ----------------------

* gaps_settings:

  - gaps_finder:

    -{'gapsize_n': 40}

* gaps_info:

  - gap:

    -{'label_columnname': 'is_gap', 'outlier_flag': 'gap', 'negative_flag': 'no gap', 'numeric_flag': 12, 'apply_on': 'record'}

  - missing_timestamp:

    -{'label_columnname': 'is_missing_timestamp', 'outlier_flag': 'missing timestamp', 'negative flag': 'not missing', 'numeric_flag': 13, 'apply_on': 'record'}

* gaps_fill_settings:

  - linear:

    -{'method': 'time', 'max_consec_fill': 100}

  - model_debias:

    -{'debias_period': {'prefered_leading_sample_duration_hours': 48, 'prefered_trailing_sample_duration_hours': 48, 'minimum_leading_sample_duration_hours': 24, 'minimum_trailing_sample_duration_hours': 24}}

  - automatic:

    -{'max_interpolation_duration_str': '5H'}

* gaps_fill_info:

  - label_columnname:

    -final_label

  - label:

    -{'linear': 'gap_interpolation', 'model_debias': 'gap_debiased_era5'}

  - numeric_flag:

    -21

 ---------------- missing_obs (settings) ----------------------

* missing_obs_fill_settings:

  - linear:

    -{'method': 'time'}

* missing_obs_fill_info:

  - label_columnname:

    -final_label

  - label:

    -{'linear': 'missing_obs_interpolation'}

  - numeric_flag:

    -23

 ---------------- templates (settings) ----------------------

* template_file:

  -/home/thoverga/Documents/VLINDER_github/MetObs_toolkit/metobs_toolkit/datafiles/demo_templatefile.csv

 ---------------- gee (settings) ----------------------

* gee_dataset_info:

  - global_lcz_map:

    -{'location': 'RUB/RUBCLIM/LCZ/global_lcz_map/v1', 'usage': 'LCZ', 'band_of_use': 'LCZ_Filter', 'value_type': 'categorical', 'dynamical': False, 'scale': 100, 'is_image': False, 'is_imagecollection': True, 'categorical_mapper': {1: 'Compact highrise', 2: 'Compact midrise', 3: 'Compact lowrise', 4: 'Open highrise', 5: 'Open midrise', 6: 'Open lowrise', 7: 'Lightweight lowrise', 8: 'Large lowrise', 9: 'Sparsely built', 10: 'Heavy industry', 11: 'Dense Trees (LCZ A)', 12: 'Scattered Trees (LCZ B)', 13: 'Bush, scrub (LCZ C)', 14: 'Low plants (LCZ D)', 15: 'Bare rock or paved (LCZ E)', 16: 'Bare soil or sand (LCZ F)', 17: 'Water (LCZ G)'}, 'credentials': 'Demuzere M.; Kittner J.; Martilli A.; Mills, G.; Moede, C.; Stewart, I.D.; van Vliet, J.; Bechtel, B. A global map of local climate zones to support earth system modelling and urban-scale environmental science. Earth System Science Data 2022, 14 Volume 8: 3835-3873. doi:10.5194/essd-14-3835-2022'}

  - DEM:

    -{'location': 'CGIAR/SRTM90_V4', 'usage': 'elevation', 'band_of_use': 'elevation', 'value_type': 'numeric', 'dynamical': False, 'scale': 100, 'is_image': True, 'is_imagecollection': False, 'credentials': 'SRTM Digital Elevation Data Version 4'}

  - ERA5_hourly:

    -{'location': 'ECMWF/ERA5_LAND/HOURLY', 'usage': 'ERA5', 'band_of_use': {'temp': {'name': 'temperature_2m', 'units': 'K'}}, 'value_type': 'numeric', 'dynamical': True, 'scale': 2500, 'is_image': False, 'is_imagecollection': True, 'time_res': '1H', 'credentials': ''}

  - worldcover:

    -{'location': 'ESA/WorldCover/v200', 'usage': 'landcover', 'band_of_use': 'Map', 'value_type': 'categorical', 'dynamical': False, 'scale': 10, 'is_image': False, 'is_imagecollection': True, 'categorical_mapper': {10: 'Tree cover', 20: 'Shrubland', 30: 'Grassland', 40: 'Cropland', 50: 'Built-up', 60: 'Bare / sparse vegetation', 70: 'Snow and ice', 80: 'Permanent water bodies', 90: 'Herbaceous wetland', 95: 'Mangroves', 100: 'Moss and lichen'}, 'aggregation': {'water': [70, 80, 90, 95], 'pervious': [10, 20, 30, 40, 60, 100], 'impervious': [50]}, 'colorscheme': {10: '006400', 20: 'ffbb22', 30: 'ffff4c', 40: 'f096ff', 50: 'fa0000', 60: 'b4b4b4', 70: 'f0f0f0', 80: '0064c8', 90: '0096a0', 95: '00cf75', 100: 'fae6a0'}, 'credentials': 'https://spdx.org/licenses/CC-BY-4.0.html'}
Use the update_qc_settings() method to update the default settings.
[4]:
your_dataset.update_qc_settings(obstype='temp',
                                gross_value_max_value=26.3,
                                persis_time_win_to_check='30T' #30 minutes
                                )
To apply the quality control on the full dataset use the apply_quality_control() method. Spatial quality control checks can be applied by using the apply_buddy_check(), apply_titan_buddy_check() and apply_titan_sct_resistant_check() methods.
[5]:
your_dataset.apply_quality_control(
        obstype="temp",  # which observations to check
        gross_value=True,  # apply gross_value check?
        persistance=True,  # apply persistence check?
        step=True,  # apply the step check?
        window_variation=True,  # apply internal consistency check?
    )
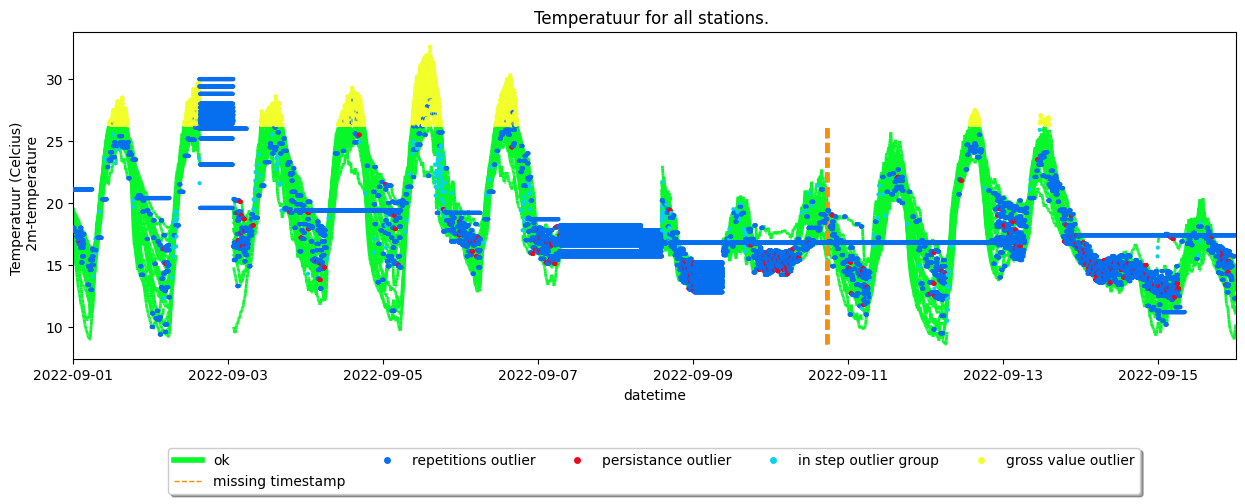
Use the dataset.show() or the time series plot methods to see the effect of the quality control.
[6]:
your_dataset.make_plot(obstype='temp', colorby='label')
[6]:
<Axes: title={'center': 'Temperatuur for all stations. '}, xlabel='datetime', ylabel='Temperatuur (Celcius) \n 2m-temperature'>
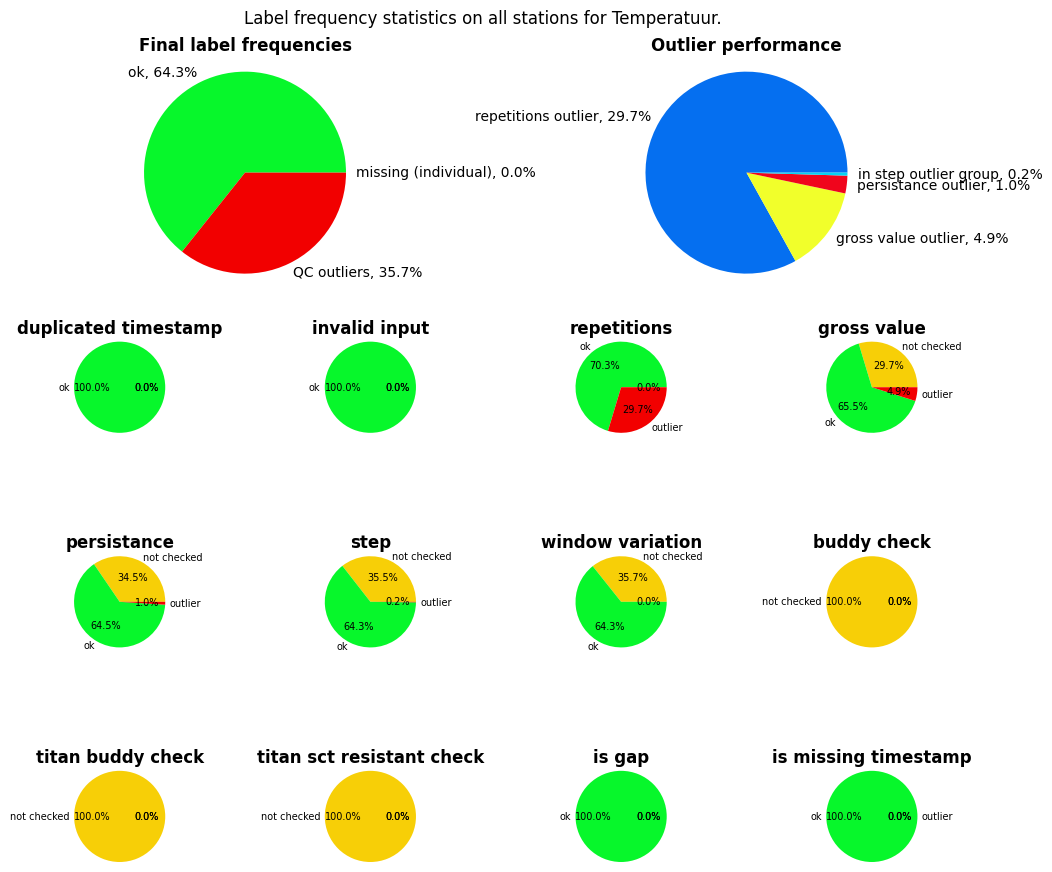
If you are interested in the performance of the applied QC, you can use the get_qc_stats() method to get an overview of the frequency statistics.
[7]:
your_dataset.get_qc_stats(obstype='temp', make_plot=True)
[7]:
({'ok': 64.28984788359789,
  'QC outliers': 35.707671957671955,
  'missing (gaps)': 0.0,
  'missing (individual)': 0.00248015873015873},
 {'repetitions outlier': 29.658564814814813,
  'gross value outlier': 4.869378306878307,
  'persistance outlier': 1.0085978835978835,
  'in step outlier group': 0.17113095238095238,
  'duplicated timestamp outlier': 0.0,
  'invalid input': 0.0,
  'in window variation outlier group': 0.0,
  'buddy check outlier': 0.0,
  'titan buddy check outlier': 0.0,
  'sct resistant check outlier': 0.0},
 {'duplicated_timestamp': {'not checked': 0.0, 'ok': 100.0, 'outlier': 0.0},
  'invalid_input': {'not checked': 0.0, 'ok': 100.0, 'outlier': 0.0},
  'repetitions': {'not checked': 0.0,
   'ok': 70.34143518518519,
   'outlier': 29.658564814814813},
  'gross_value': {'not checked': 29.658564814814813,
   'ok': 65.47205687830689,
   'outlier': 4.869378306878307},
  'persistance': {'not checked': 34.52794312169312,
   'ok': 64.46345899470899,
   'outlier': 1.0085978835978835},
  'step': {'not checked': 35.53654100529101,
   'ok': 64.29232804232805,
   'outlier': 0.17113095238095238},
  'window_variation': {'not checked': 35.707671957671955,
   'ok': 64.29232804232805,
   'outlier': 0.0},
  'buddy_check': {'not checked': 100.0, 'ok': 0.0, 'outlier': 0.0},
  'titan_buddy_check': {'not checked': 100.0, 'ok': 0.0, 'outlier': 0.0},
  'titan_sct_resistant_check': {'not checked': 100.0,
   'ok': 0.0,
   'outlier': 0.0},
  'is_gap': {'not checked': 0, 'ok': 100.0, 'outlier': 0.0},
  'is_missing_timestamp': {'not checked': 0,
   'ok': 99.99751984126983,
   'outlier': 0.00248015873015873}})
Quality control exercise#
For a more detailed reference you can use this Quality control exercise, which was created in the context of the COST FAIRNESS summer school 2023 in Ghent.