Introduction#
This package is designed for handling meteorological observations for urban or non-traditional networks. It includes tools to clean up and analyze your data.
How to install#
To use the package python 3.9 or higher is required. To install the package one can use pip:
pip install metobs-toolkit
To install the PyPi version of the toolkit. To install the github versions one can use these commands:
#main versions
pip install git+https://github.com/vergauwenthomas/MetObs_toolkit.git

#development version
pip install git+https://github.com/vergauwenthomas/MetObs_toolkit.git@dev

#specific release from github
pip install git+https://github.com/vergauwenthomas/MetObs_toolkit.git@v0.2.0
For some advanced quality control methods, the Titanlib package is used. Since the installation of titanlib requires a c++ compiler, it is categorized as a extra-dependency. This means that the user must install titanlib manually if this functionality is required or use the following command:
pip install metobs-toolkit[titanlib]
Note
To install the package in a notebook, one has to add ! in front of the pip install command.
and import it in Python
import metobs_toolkit

#Check your version
metobs_toolkit.__version__
How to use this toolkit#
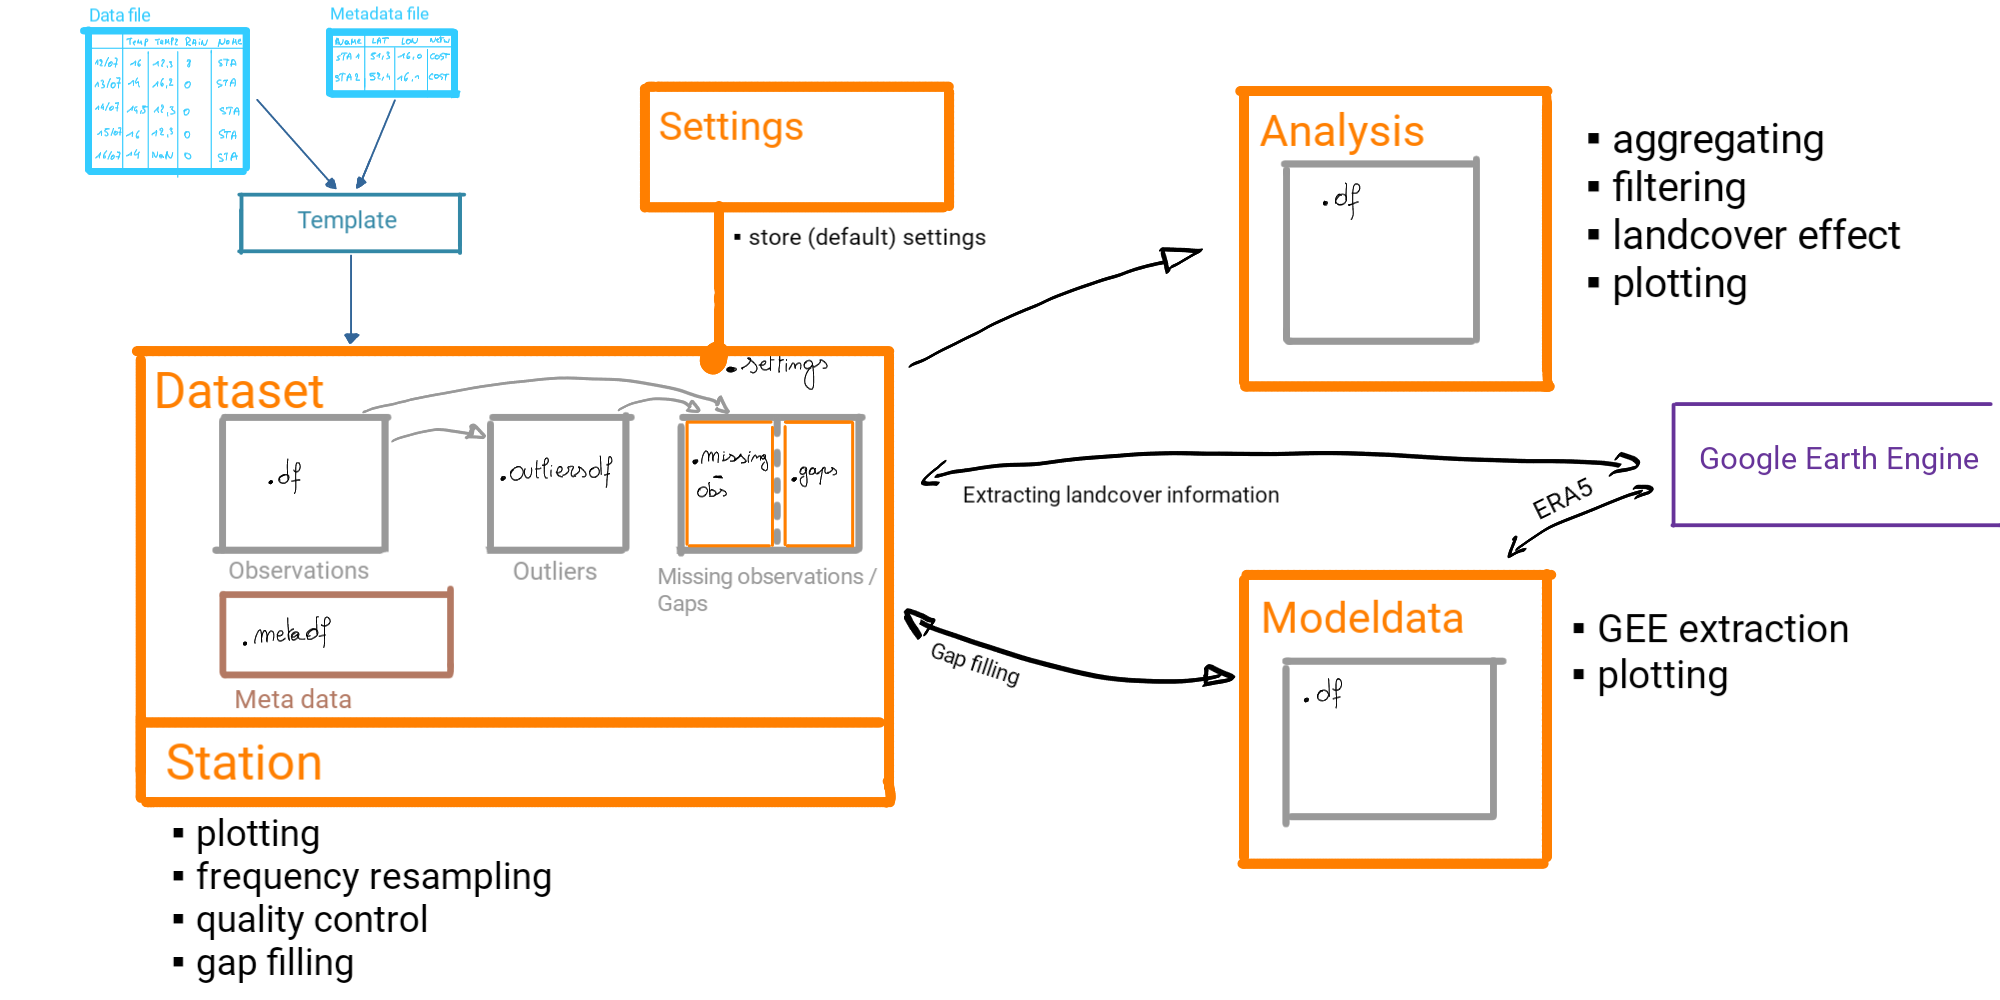
This toolkit is a Python package based on object-oriented programming (OOP). Here you can find a short description of the classes that are directly used by the users:
Dataset()#
The Dataset class is at the heart of the toolkit and it holds all observations and metadata.
your_dataset = metobs_toolkit.Dataset()
The dataset class has attributes that serve as ‘containers’ to hold data:
- Dataset.df
All(*) records will start in the df-container. This container contains the observations that we assume to be correct.
(*): One exception is the observations with a duplicated timestamp, these will be passed to the outliersdf-container directly.
- Dataset.outliersdf
When applying quality control, some observations may be labeled as outliers. When an observation is labeled as an outlier, it is added to the outliersdf-container. The records labeled as outliers are still kept inside the df-container but the observation value is removed (set to Nan).
- Dataset.missing_obs
When importing a datafile, an observation frequency is estimated for each station. A missing observation is a record that is not in the observations but is assumed by the station frequency. A missing observation is thus a record, without an observation value. These records are stored in the missing_obs-container.
- Dataset.gaps
When a sequence of (repeating) missing observations is found, a test is performed to check if the length(*) of the series is larger than a threshold (i.e. the gap definition). If the series is larger than the threshold, we interpret it as a gap and it is removed from the missing_obs-container.
(*): Note that the definition of a gap is based on a number of consecutive repeating missing records! The minimal gap size is therefore dependent on the observational frequency of each station.
- Dataset.metadf
When metadata is provided, it will be stored in the Dataset.metadf. The metadf is stored as tabular data where each row represents a station. When variables are computed that depend only on a station (No time evolution and independent of the observation type), it is stored here. All land cover information and observation frequency estimations are stored here.
Note
A record refers to a unique combination of timestamp, corresponding station, and observation type.
Station()#
A Station is a class that has the same attributes and methods as a Dataset, but all the observations are limited to a specific station.
your_station = your_dataset.get_station(stationname = 'station_A')
Analysis()#
The Analysis class is created from a Dataset and holds the observations that are assumed to be correct (the df-container of the Dataset). In contrast to the Dataset, the Analysis methods do not change the observations. The Analysis methods are based on aggregating the observations to get insight into diurnal/seasonal patterns and landcover effects.
your_dataset_analysis = your_dataset.analysis()
Note
Creating an Analysis of a Station is not recommended, since there is not much scientific value in it.
Modeldata()#
The Modeldata holds time-series of data from a source other than observations (i.g. a model). The time-series are taken at the same coordinates as the stations and the names of the stations are used as well.
This class is used for comparing other sources to observations and for filling in missing observations and gaps in the observations.
ERA5_timeseries = your_dataset.get_modeldata(modelname='ERA5_hourly',
                                             obstype='temp')
The toolkit makes use of the Google Earth Engine (GEE), to extract these time-series. To use the GEE API, follow these steps on Using Google Earth Engine.
Settings()#
Each Dataset holds its own set of Settings. When creating a Dataset instance, the default settings are attached to it. When another class is created (i.g. Station, Modeldata, …) from a Dataset, the corresponding settings are inherited.
There are methods to change some of the default settings (like quality control settings, timezone settings, gap fill settings, …). To list all the settings of a class one can use the show method on it:
#Create a Dataset, the default settings are attached to it
your_dataset = metobs_toolkit.Dataset()

#Update the timezone from 'UTC' (default) to Brussels local time
your_dataset.update_timezone(timezonestr='Europe/Brussels')

#create a Station instance from your dataset
your_station = your_dataset.get_station(stationname = 'station_A')

#Since the settings are inherited, your_stations has also the timezone set to Brussels local time.

# print out all settings
your_dataset.settings.show()
your_station.settings.show()
Schematic overview#
